We’re excited to launch a new feature: Charting Transit. Each month, we’ll spotlight a transit trend or data point, using data visuals to tell the story of public transportation in Northern Virginia.
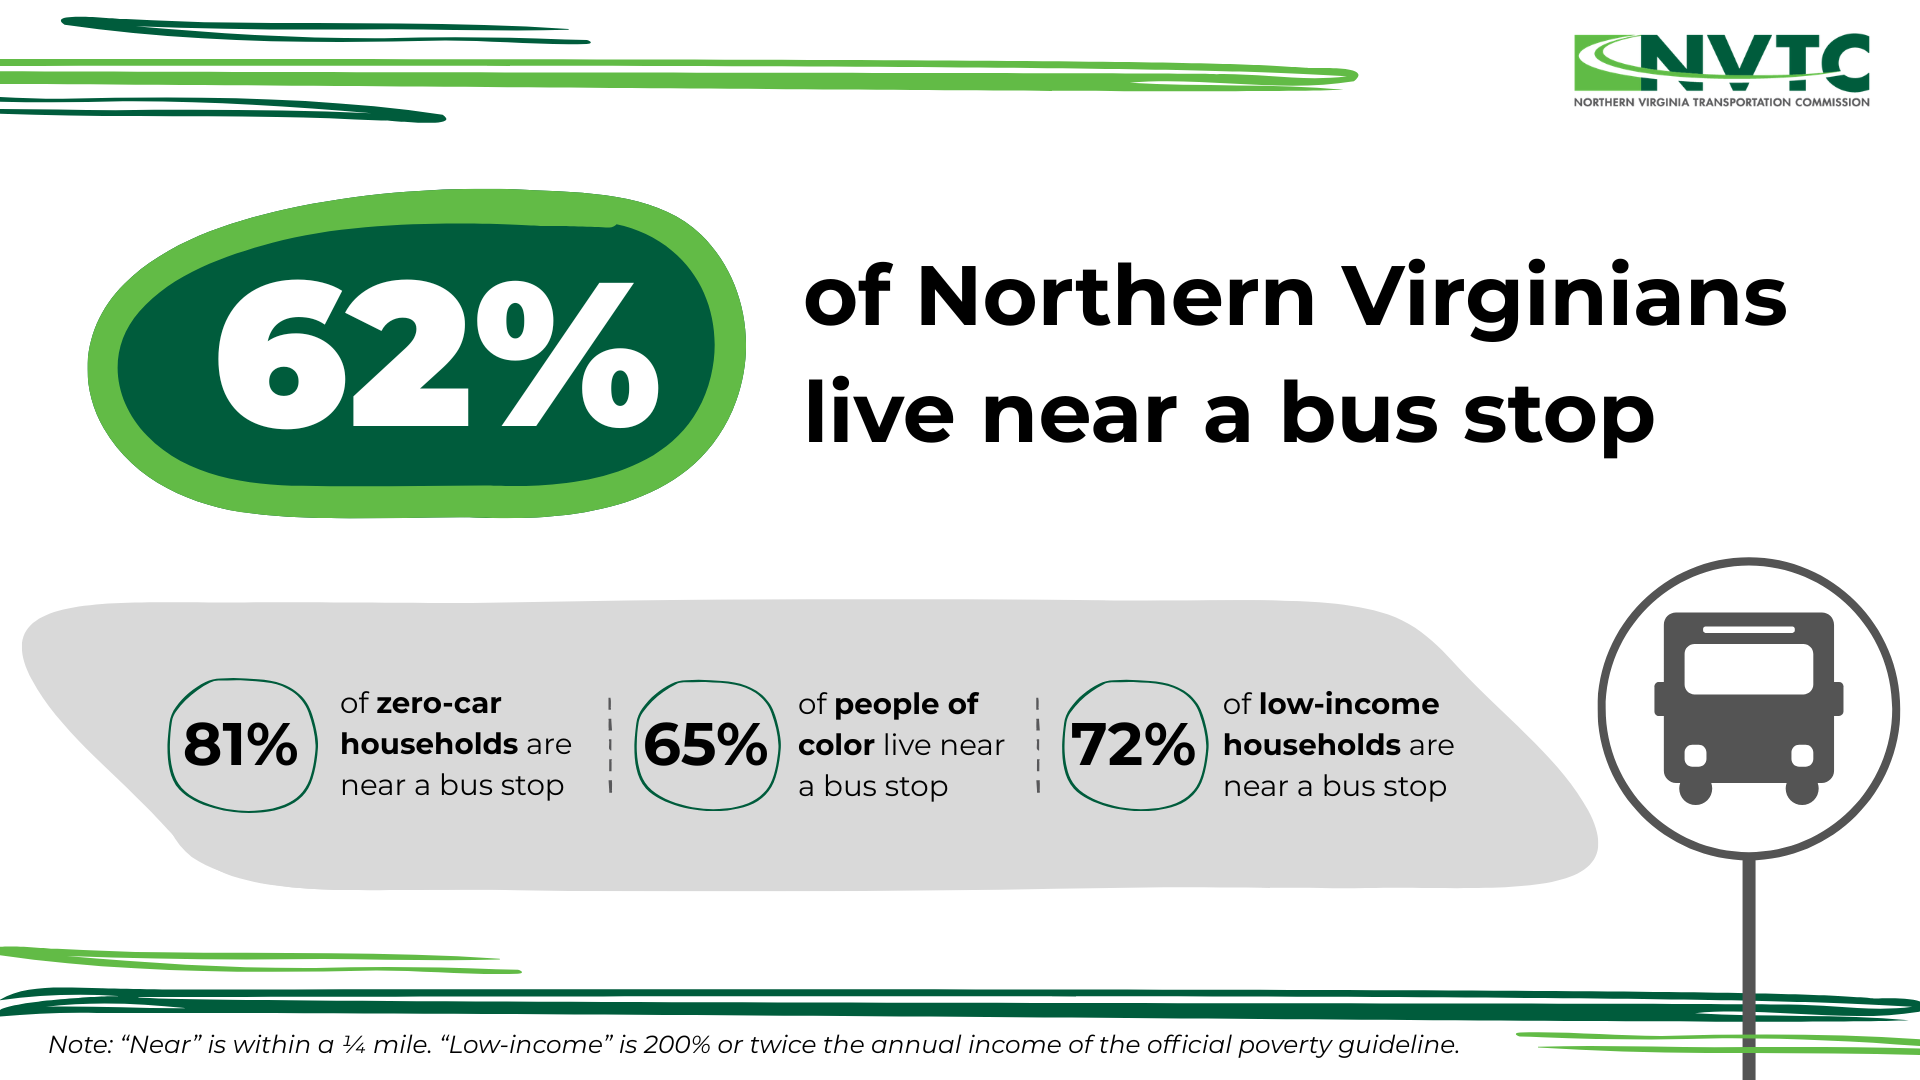
This month, we’re highlighting bus accessibility across our region using data from NVTC’s NoVaTransit Data Dashboard. The data reveal how critical bus service is to connecting diverse communities. Well over half of Northern Virginians live near a bus stop, and the numbers are even higher for people of color, households without a car and households with limited financial resources.